The Big Picture…
We know that Innovation diffusion occurs over channels in a social network.
So can we apply knowledge of network topology to understand and/or increase diffusion?
Find influencers
The Idea
When I looked at innovation diffusion – we used the classic definition:
Diffusion is the process by which an innovation is communicated through certain channels over time among the members of a social system.
Rogers – Diffusion of Innovation
And I did so from a network perspective. Starting with Bass’ view of there being innovators and imitators. Moving to Rogers’ view that looked at five adopter types. I showed these as groupings on a network where connectivity moved left to right over time.

Although the network shown was not strictly correct, it was useful to visualise what happens. Diffusion goes between nodes in a network via certain channels over time. It starts with Innovators, progresses to early adopters, then the early majority etc. We found there’s a chasm between early adopters and early majority (particularly for high tech innovations). And Maloney informed us the message and medium used for the first 16% needs to be different to that used for the rest.
As we know there’s a network. Can we use the ideas from network topology to understand better if the network will support the spreading of information? Or will the structure create challenges? And how can we use the network structure to our advantage? Pyo, Gruca and Russell tell us:
The non-adopter adopts faster as she is exposed to a higher proportion of adopter friends among all of her friends
“A New Bass Model Utilizing Social Network Data“
Network topology offers us the promise to discover influencers, groups of loosely connected adopter types, mavens, and potential problem areas. But what is it?
Network Topology
Not every network is the same. We find, as you can see in Figure X, that some have a hub and spoke look. Where there are clusters of nodes and those clusters connect to each other through a few nodes.

Others networks look like volcanoes where almost every node is connected to a central node. Others still wrap around themselves with connection like a torus.
If we can understand the social system’s topology, we get some insights into how to diffusion is likely to work, where it might stall, and how to increase our odds. Network topology, whilst we can visualise in a diagram, is more commonly captured by describing a set of attributes the network has.
Network attributes
We can see the topologies above as shorthand names for specific values of a set of network attributes. Such as those in Figure 3.
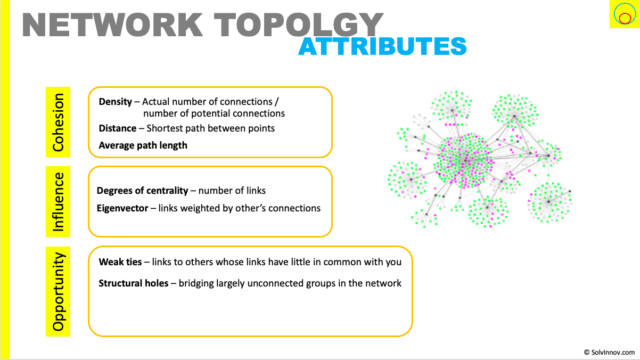
We could write article after article on network topologies and metrics. You can find some descriptions in this Wikipedia article.
[Editing below]
What do attributes tell us about Diffusion?
And these: https://pdfs.semanticscholar.org/00b5/c5a40fa07938bd74091257591bce87f9bc2c.pdf
Let’s consider some examples
Density and diffusion success probability
The less dense a social system is, the more likely diffusion will fail.
Think of a network of 100 people. Let’s say everyone is connected to everyone. Here the density would be 99/99, or 100%. There’s lots of redundant channels for diffusion to travel over.
But what if each person can only talk to at most 2 neighbors? Well, each person could still potentially talk to 99 others, but can practically only talk to at most 2. This has a very low density: 2/99 or 2%. It just takes one person to refuse to diffuse and division stops
Weak ties – crossing group boundaries
Several groups of people, each group sharing some an attribute that is different. However, the are some people in each group connected loosely to some in the next group. This is better for diffusion than the first example. But, if those connecting people don’t diffuse then we might observe a chasm preventing diffusion.
Structural holes – carrying innovation
IT consultancies (should) act as organisations with weak ties, bridging holes. By this I mean that they are active in many different industries and markets. And so, they have a great opportunity to “carry” innovations from one to another.
Eigenvectors and Mavens
Eigenvectors can help us understand the importance of a node – Google used them in the initial page rank algorithm. This might help us find the Mavens that Gladwell talks of in The Tipping Point.
Degrees of centrality and social influencers
if we can identify a person with a very high out-degree of centrality (i.e. connected to a lot of people) we might have found a “social influencer”
Finding a networks topology
It sounds great, right? Finding a networks topology means we can find the influencers, the weak points, and work out how to accelerate diffusion. Sadly, in practice it can be a little harder.
What if we are looking at an organisation? We could believe that the hierarchical organisation chart is the social system. However, if we look at who regularly talks to who, a different social system would emerge. And it is that second social system that usually affects diffusion. We can run surveys to discover this. Or even analyse communication tools the organisation uses, such as email threads.
Outside an organisation is a little more difficult. People in general are less likely to answer surveys and we can’t monitor communications. However, social networks, such as LinkedIn and Facebook, offer a little hope of understanding some networks better.
https://en.m.wikipedia.org/wiki/Social_network_analysis_software
“
It is now clear that different types of network structures yield predictable differences in aggregate diffusion curves (Dover, Goldenberg and Shapira, 2012, Trusov, Rand and Joshi, 2013).” https://www.researchgate.net/profile/Gary_Russell2/publication/317168743_A_New_Bass_Model_Utilizing_Social_Network_Data/links/592841b60f7e9b9979a3571f/A-New-Bass-Model-Utilizing-Social-Network-Data.pdf?origin=publication_detail
calibration of the classical Bass model on sparsely-connected social networks results in biased estimates of diffusion parameters: social influence (q) in the Bass model is biased downward, while external influence (p) is biased upward. In contrast, we show that the diffusion parameters of the NBB model are accurate regardless of the network structure. Moreover, the NBB provides superior fit compared to the traditional Bass model. https://www.researchgate.net/profile/Gary_Russell2/publication/317168743_A_New_Bass_Model_Utilizing_Social_Network_Data/links/592841b60f7e9b9979a3571f/A-New-Bass-Model-Utilizing-Social-Network-Data.pdf?origin=publication_detail
“
https://www.sciencedirect.com/science/article/pii/S0167811618300284
The effect of social networks structure on innovation performance: A review and directions for research
Social network effects on the extent of innovation diffusion: a computer simulation. https://faculty.wharton.upenn.edu/wp-content/uploads/2012/05/social_network_effects1.pdf
Social Network Thresholds In The Diffusion Of Innovations. https://solvinnov.com/literature/social-network-thresholds-in-the-diffusion-of-innovations/
The impact of network structure on diffusion of innovation. https://solvinnov.com/literature/diffunet-the-impact-of-network-structure-on-diffusion-of-innovation/
Network model of the diffusion of innovation. https://solvinnov.com/literature/network-models-and-methods-of-studying-the-diffusion-of-innovation/